 2018, Vol. 37
文章信息
- 郑雪芳, 刘波, 朱育菁, 王阶平, 陈倩倩, 魏云华
- ZHENG Xue-fang, LIU Bo, ZHU Yu-jing, WANG Jie-ping, CHEN Qian-qian, WEI Yun-hua
- 磷脂脂肪酸生物标记法分析养猪发酵床微生物群落结构的空间分布
- Spatial distribution of microbial communities in a fermentation bed based on phospholipid fatty acid biomarkers
- 农业环境科学学报, 2018, 37(4): 804-812
- Journal of Agro-Environment Science, 2018, 37(4): 804-812
- http://dx.doi.org/10.11654/jaes.2017-1225
文章历史
- 收稿日期: 2017-09-08
- 录用日期: 2017-12-04


2. 福建省农业科学院农业工程技术研究所, 福州 350003
2. Agricultural Engineering and Technology Institute, Fujian Academy of Agricultural Sciences, Fuzhou 350003, China
我国是养猪大国,每年猪粪的产生量突破50亿t,粪污已成为当今社会三大污染源之一[1]。微生物发酵床养猪是一种新型环保养猪模式,利用农业副产品如谷壳、秸杆、锯糠、椰糠等制作发酵床垫料层,添加微生物菌剂,经发酵铺垫到猪舍,生猪生活在发酵床上,通过发酵床形成的有益微生物群落分解猪粪,消除恶臭,实现猪场的零排放[2-3]。
微生物发酵床养猪的核心技术是利用其形成的有益功能微生物种群,长期和持续稳定地将猪粪尿进行降解。因此,研究发酵床的微生物群落结构对于揭示发酵床对猪粪尿的降解、转化规律等具有重要意义[4-5]。赵国华等[6]研究发酵床养猪模式下不同使用年限微生物群落的变化,利用微生物分离结合16S rRNA分子生物学鉴定对发酵床微生物群落进行分析;张学峰等[7]利用微生物分离结合16S rRNA研究了不同深度垫料对养猪土著微生物发酵床稳定期微生物菌群的影响;李娟等[8]进行了鸡发酵床不同垫料理化性质及微生物菌群变化规律研究。作者前期研究[9]中利用磷脂脂肪酸(Phospholipid Fatty Acid,PLFA)生物标记分析了不同使用时间发酵床微生物群落结构的动态变化规律,Yin等[10]采用传统培养结合分子生物学技术研究发酵床养猪模式下细菌的种群结构。然而,目前关于发酵床微生物群落结构的空间分布研究鲜见报道。
微生物群落的研究通常采用传统分离培养法,但是许多功能微生物都处于存活不可培养状态[11-13]。PLFA图谱分析是近几年来发展的研究微生物群落结构的一种新方法,它可定量分析微生物群落的生物量和群落结构[14-15]。本研究利用PLFA法研究大栏养猪发酵床微生物群落的空间分布特性,寻找出其变化规律,为微生物发酵床大栏养殖提供理论依据。
1 材料与方法 1.1 实验选址和饲养环境实验地点位于福清市渔溪现代设施农业样本工程示范基地的微生物发酵床大栏养猪舍,猪舍长93 m、宽33 m,占地总面积为3069 m2,其中发酵床面积1617 m2,深度为75 cm,使用时间为1年,发酵床垫料由谷壳30%、椰糠70%构成。猪舍装配自动喂料和饮水系统、微喷雾化空气消毒系统、喷雾垫料加湿系统、环境(光、温、湿、NH3、通风)监控系统。猪舍温度控制在28~32 ℃,湿度控制在60%~70%。定期对垫料进行翻堆(每周2~3次将表层垫料进行翻耙,2个月深翻一次,每批猪出栏后,用新垫料替换表层腐熟程度高的垫料),猪只1500头,为“杜×长×大”三元杂交商品猪,采用大栏养殖模式,饲养密度为1头·m-2,常规管理。
1.2 取样方法将整个发酵床划分为5个不同的区域:A、B、C、D和E。每个区域再划分为3个层次:表层(0~25 cm)、中间层(25~50 cm)、底层(50~75 cm)。A区靠近风机,E区靠近水帘,B、C、D区为仔猪活动和排便密集区域(图 1)。每个区域的每层取样方法为五点取样,每层的样本充分混合后取出小样(10 g),进行PLEA测定,每个小样设3个重复。

|
| 图 1 微生物发酵床样本采集示意图 Figure 1 Schematic of sample collection in microbial fermentation bed |
PLFA的提取方法参考文献[16-17]并略作修改。具体操作如下:称取10 g样本至50 mL离心管中,加入20 mL 0.2 mol·L-1的KOH甲醇溶液,充分混匀,37 ℃水浴1 h(每10 min涡旋1次);加入3 mL 1.0 mol·L-1的醋酸溶液,充分摇匀;加入10 mL正已烷,充分摇匀,在6000 r·min-1条件下离心10 min;将上层溶液转入干净玻璃瓶中,在N2气流下挥发掉溶剂;加入1 mL体积比为1:1的甲基叔丁基醚:正已烷溶液,充分溶解,转入GC小瓶,用于脂肪酸测定。
PLFA成分采用美国Agilent 6890N型气相色谱仪测定。色谱柱HP-ULTRA2(25 m×0.2 mm×0.33 μm),采用分流进样,分流比为100:1,进样量为1 μL。二阶程序升高柱温:柱温先以5 ℃·min-1由170 ℃升至260 ℃,再以40 ℃·min-1由260 ℃升温至310 ℃,保持90 s。汽化室温度为250 ℃,检测器温度为300 ℃,柱前压10.00 psi(1 psi=6.895 kPa)。载气(H2)流速为2 mL·min-1,尾吹气(N2)流速为30 mL·min-1。PLFA的鉴定利用Sherlock MIS 4.5系统(MIDI,Newark,Delaware,美国)。
1.4 数据统计与分析(1)PLFA生物标记的识别:不同PLFA指示不同类群的微生物,一些饱和或单不饱和脂肪酸代表细菌生物量,其中支链磷脂脂肪酸常见于革兰氏阳性细菌(G+)如i11:0、a12:0、i12:0等[18];环化脂肪酸和单烯不饱和脂肪酸在革兰氏阴性细菌(G-)中占比高,如cy17:0、cy19:0 w8c、10:0 3OH等[19-21];18:1w9c、18:3w6,9,12等多烯脂肪酸为真核生物所独有,其总和可指示真菌生物量[22];指示放线菌脂肪酸的有10Me16:0、10Me17:0和10Me18:0[23]。
(2)微生物群落多样性指数分析:引入群落生态学丰富度指数Shannon、多样性指数Simpson和均匀度指数Pielou,分析发酵床不同空间垫料微生物群落的多样性。按照计算物种指数方法[24]计算各指数值。
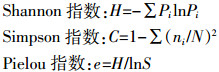
式中:S为群落中的脂肪酸总种类数;Pi =ni /N;ni为i类脂肪酸个数;N为该试验中总脂肪酸个数。
(3)聚类分析采用DPS软件,以供试样品的PLFA为样本,进行单因子方差分析,构建矩阵,以兰氏距离为聚类尺度,用类平均法进行系统聚类,分析发酵床不同空间微生物种群动态。
(4)采用DPS软件中多元统计分析中的主成分分析(Principal Component Analysis,PCA)方法,主要包括数据求协方差矩阵,计算特征方程中所有特征值,并根据特征值累积比例确定主成分的数量,计算主成分载荷值和主成分得分,进行一级主成分评分等。主成分分析过程采用DPS软件的相关模块进行处理,具体步骤参见文献[25]。
2 结果与分析 2.1 发酵床不同空间垫料微生物PLFA测定微生物发酵床不同空间垫料共检测到57个脂肪酸生物标记,不同的生物标记代表不同类型的微生物(表 1)。脂肪酸生物标记15:0、17:0、a15:0、16:1 w9c、10Me18:0、18:1 w9c和20:1 w9c在各样本中均有分布,属完全分布类型,说明这类脂肪酸指示的微生物适应性强,在各空间小生境均能生长;10:0、11:0、20:4 w6,9,12,15c等其余50种脂肪酸生物标记只在发酵床特定空间分布,为不完全分布,说明大部分微生物只在特定环境下生长;a12:0、i17:1 w10c、18:3 w6,9,12和20:1 w7c只在发酵床的A区分布,17:1 w6只在发酵床的B区分布,16:0 3OH只在发酵床的B区表层分布,15:0 3OH和16:0 2OH只在发酵床的E区表层分布。A区分布量最大的前3种PLFA为18:1 w9c、i17:1 w10c和16:1 w9c;B区和D区分布量最大的前3种PLFA为16:0、18:1 w9c和i15:0;C区和E区分布量最大的前3种PLFA为16:0、18:1 w9c和a15:0;A区PLFA种类最少,其表层、中间层和底层分别为17、12种和16种,B区PLFA种类最多,其表层、中间层和底层分别为45、45种和44种。

|
由表 2可以看出,微生物发酵床不同空间垫料细菌、真菌、放线菌、革兰氏阳性细菌、革兰氏阴性细菌和总PLFA含量差异显著(P<0.05)。D区表层最大,分布量分别为994.24、286.83、33.65、357.75、69.38 nmol·g-1和1 315.70 nmol·g-1,均显著高于其他空间(P<0.05);这些特征微生物PLFA含量在各个区域表层(A区表层的G+、B区表层的真菌和放线菌含量除外)垫料分布量均高于中间层和底层;A区各层次垫料细菌、真菌、革兰氏阳性细菌和总PLFA含量均显著低于其他区域(P<0.05);细菌、真菌和放线菌在各个空间垫料分布量均为细菌>真菌>放线菌。

|
由图 2可见,A区各层次真菌/细菌值极显著高于其他区域(P<0.01),而G+/G-值则极显著低于其他区域(P<0.01)。B、C、D、E各区域和各层次之间的真菌/细菌值和G+/G-值无显著差异。

|
| L1、L2、L3分别为表层、中间层和底层。下同 L1, L2 and L3 were referred to surface layer, middle layer and bottom layer, respectively. The same below 图 2 微生物发酵床不同空间垫料真菌/细菌和G+/G-值 Figure 2 Fungi/bacteria and G+/G- for microbial fermentation bed in different spatial |
如表 3所示,发酵床不同空间垫料的Simpson指数、Shannon指数和Pielou指数均呈现显著差异(P<0.05)。Simpson指数和Shannon指数最大值均出现在C区底层,分别是0.881 3和3.777 9,C区底层的Pielou指数较大,为0.709 9,仅次于A区中间层(0.759 8)和A区底层(0.751 1)。A区3个层次的Simpson指数和Shannon指数小于其他区域,Pielou指数大于其他区域,其中A区表层和中间层的Simpson指数最小,为0.821 4,A区中间层的Shannon指数最小,为2.723 7,A区中间层的Pielou指数最大,为0.759 8。

|
发酵床不同空间垫料聚类结果如图 3所示。当兰氏距离为117.1时,可将不同空间垫料聚为两个类群,A区3个层次的垫料聚在一个类群(类群Ⅰ),其他区域各层次聚在另一类群中(类群Ⅱ);当兰氏距离为23.4时,可将类群Ⅱ细分为2个亚类群,B区和D区在一个亚类群,C区和E区聚在同一亚类群中,相同区域不同层次样本均在同一类群中。由此可见,发酵床垫料PLFA分布与区域性关系更为密切。

|
| 图 3 微生物发酵床群落结构空间分布的聚类分析 Figure 3 Cluster analysis of microbial community for microbial fermentation bed in different spatial |
基于PLFA发酵床不同空间垫料经主成分分析得出,主成分1(PC1)贡献率为52.08%,主成分2(PC2)贡献率为72.26%,PC1和PC2基本能将发酵床不同空间垫料样本区分出来(图 4)。A区3个不同层次垫料样本归在一类群;D区和B区的3个不同层次垫料样本归在一类群;C区和E区的3个不同层次垫料样本归在一类群;A区的3个不同层次垫料微生物种群与PC1和PC2均呈负相关;E区3个不同层次垫料微生物种群与PC1和PC2均呈正相关;D区和B区的3个不同层次垫料微生物种群与PC1呈正相关,与PC2均呈负相关;C区垫料表层微生物与PC1和PC2呈正相关,中间层和底层与PC1呈负相关,与PC2均呈正相关。

|
| 图 4 微生物发酵床群落结构空间分布的主成分分析 Figure 4 PCA analysis of microbial community for microbial fermentation bed in different spatial |
微生物发酵床是通过基质垫层微生物群落来完成对猪粪尿的降解[26]。然而,目前关于发酵床与微生物群落的密切相关性知之甚少。Bardgett等[27]认为土壤中PLFA的组成可以表示土壤微生物群落的组成和结构。Klamer等[28]和Stegera等[29]的研究指出,脂肪酸量的增减能很好地反映微生物种群的兴衰。本研究利用PLFA生物标记技术研究发酵床微生物群落空间分布特性,以期探明发酵床对猪粪的降解机理。发酵床不同空间垫料共检测出C10~C20共57个脂肪酸生物标记,表明发酵床存在丰富的微生物种类,研究结果与刘波等[30]对发酵床宏基组分析结果相吻合。研究发现发酵床不同空间垫料PLFA的种类和含量都不同,A区各层垫料检测的PLFA种类最少,B区各层垫料中PLFA种类最多。D区表层垫料细菌、真菌、放线菌、革兰氏阳性细菌、革兰氏阴性细菌和总PLFA含量明显高于其他区域。此外,各个区域表层PLFA种类和数量高于中间层和底层,说明发酵床表层微生物种类最多、分布数量最大,可能是因为:①表层直接触新鲜猪粪尿,粪尿输入提供营养,促进微生物的生长;②中间层和底层温度高,可达60~70 ℃[5, 31-32],高温杀死了一部分微生物,从而导致中间层和底层微生物种类和数量低于表层。张学峰等[7]研究表明,发酵床从30 cm至70 cm垫料中微生物数量依次降低,认为其是不同深度垫料的温度、含氧量、微生物分解原材料等综合作用的结果。
G+细菌和G-细菌是生态系统中细菌的重要组成部分[33]。Merilä等[34]认为G+细菌能够适应条件较差的环境,且在资源有限的情况下更擅长竞争资源,而G-细菌的生存更依赖环境提供新鲜的有机物。Saetre等[35]同样认为较高比例的G+细菌是环境从富营养到寡营养的转变。作者前期对不同使用时间垫料微生物群落结构的研究中发现,使用时间为1个月的垫料,主要以G-细菌为优势菌,形成的群落结构为初始群落;使用时间为6个月垫料中G-和G+细菌含量相当,为过渡型群落;而使用时间为24个月垫料则以G+细菌为优势菌,为稳定型群落[9]。本研究发现,A区垫料的G+/G-小于1,G-细菌为优势菌,为初始群落;而发酵床B、C、D、E区垫料的G+/G-大于1,说明这些区域G+细菌分布量大于G-细菌,发酵床已形成稳定的群落结构,此外也预示着这些区域垫料的营养条件下降,可以考虑补充新鲜的垫料。
多样性指数对于评价微生物群落多样性是非常有效的方法,高的多样性指数代表高的微生物群落多样性[36]。Simpson指数反映群落中常见物种数量[37],Shannon指数反映群落中物种的丰富度[38],Pielou指数反映群落中各物种分布的均匀度[39]。本研究显示,Simpson指数、Shannon指数和Pielou指数在发酵床不同区域,甚至同一区域不同层次均存在显著差异,表明随着发酵床微生态系统的确立,不同空间区域小环境不同会造成微生物群落结构的空间异质性,如一些微生物种类适应在垫料表层环境生存,而另一些微生物种类则能适应或忍耐垫料深层次高温环境而存在于这个生态系统中。发酵床A区的Pielou指数大于其他区域,而Simpson指数和Shannon指数小于其他区域,说明该区域垫料中微生物种类少、分布量低,但分布均匀,与PLFA测定结果相吻合,即A区PLFA种类最少,其表层、中间层和底层分别为17、12种和16种,远低于其他区域(一般超过40种)。
微生物组成及群落结构与外界环境(温度、湿度、通风性等)密切相关,是环境变化的早期响应指标[40]。本研究为大栏养猪,发酵床面积大,每个区域面积约为325 m2,由于通风和水帘等设备分布位置不同,造成不同区域局部小气候差异,从而形成不同群落结构。聚类分析和主成分分析均显示发酵床A区3个层次垫料样本单独归一类群,B区和D区样本划分为一类,C区和E区样本归为另一类群中,说明B区和D区垫料形成相似微生物群落结构,而C区和E区的微生物群落结构相似。A区垫料与B、C、D、E区形成不同的微生物群落,这可能是因为A区靠近风机,风力大,基质垫料较干燥,影响发酵床的发酵进程,该区域微生物种类和数量均明显低于其他区域。B、C、D区为中间区域,通风和湿度最适宜,为仔猪集中活动和排便的主要场所,发酵床发酵速度快,形成微生物种类多、数量大,因此,这些区域基质垫料熟化快,要注意新垫料的添加。当然,发酵床的微生物发酵是一个复杂的生物化学过程,而此过程是通过基质垫层微生物群落的演替来完成的,在该过程中,每一个微生物群落在一定的时间有适合自身生长繁殖的条件,对某一种或某一类特定物质的降解起作用[26],在后续研究中,还需结合其他技术如宏基因组技术对发酵床的不同使用时间、不同空间、不同材质垫料的群落结构进行进一步的研究,以期为发酵床科学管理和利用提供更完整的依据。
4 结论大栏养猪发酵床微生物群落结构在不同区域和层次均存在明显差异:(1)细菌、真菌、放线菌、革兰氏阳性细菌、革兰氏阴性细菌和总PLFA含量在各个区域表层分布量高于中间层和底层,D区表层分布量最大;A区各层次真菌/细菌值显著高于其他区域,而G+/G-值则显著低于其他区域;(2)不同区域和层次的垫料Simpson指数、Shannon指数和Pielou指数值均呈现显著差异;(3)A区垫料形成的微生物群落结构不同于其他区域,B区和D区垫料的微生物群落结构相似,C区和E区垫料的微生物群落结构相似。
| [1] |
李林, 付沿东. 浅谈标准化养殖场粪污处理与综合利用技术[J]. 山东畜牧兽医, 2017, 38(5): 36-37. LI Lin, FU Yan-dong. Brief talk about treatment and comprehensive utilization of waste in the poultry farms[J]. Shandong Journal of Animal Science and Veterinary Medicine, 2017, 38(5): 36-37. |
| [2] |
刘波, 朱昌雄. 微生物发酵床零污染养猪技术的研究与应用[M]. 北京: 中国农业科学技术出版社, 2009. LIU Bo, ZHU Chang-xiong. Research and application of microbial fermentation-bed for pig raising[M]. Beijing: Chinese Agricultural Science and Technology Press, 2009. |
| [3] |
Chen Q Q, Liu B, Wang J P, et al. Diversity and dynamics of the bacterial community involved in pig manure biodegradation in a microbial fermentation bed system[J]. Annals of Microbiology, 2017, 67(7): 491-500. DOI:10.1007/s13213-017-1278-y |
| [4] |
Groenestein C M, Oosthoek J, Faassen H G V. Microbial processes in deep-litter systems for fattening pigs and emission of ammonia, nitrous oxide and nitric oxide[J]. International Journal for Vitamin & Nutrition Research, 1993, 82(3): 168-176. |
| [5] |
Tam N F Y, Vrijmoed L L P. Effects of the inoculum size of a commercial bacterial product and the age of sawdust bedding on pig waste decomposition in a pig-on-litter system[J]. Water Management & Research, 1993, 11(2): 107-115. |
| [6] |
赵国华, 方雅恒, 陈贵. 生物发酵床养猪垫料中营养成分和微生物群落研究[J]. 安微农业科学, 2015, 48(8): 98-101. ZHAO Guo-hua, FANG Ya-heng, CHEN Gui. Study on the nutritional components and microbial community in the beddings of pig raising by bio-fermentation bed[J]. Journal of Anhui Agricultural Sciences, 2015, 48(8): 98-101. |
| [7] |
张学峰, 周贤文, 陈群, 等. 不同深度垫料对养猪土著微生物发酵床稳定期微生物菌群的影响[J]. 中国兽医学报, 2013, 33(9): 1458-1462. ZHANG Xue-feng, ZHOU Xian-wen, GHEN Qun, et al. The influence of padding of different depth in native microorganism fermentation bed of pigs on microbial flora during steady period[J]. Chinese Journal of Veterinary Science, 2013, 33(9): 1458-1462. |
| [8] |
李娟, 石绪根, 李吉进, 等. 鸡发酵床不同垫料理化性质及微生物菌群变化规律的研究[J]. 中国畜牧兽医, 2014, 41(2): 139-143. LI Juan, SHI Xu-gen, LI Ji-jin, et al. Study on physic-chemical properties and microorganisms of litter during feeding broilers in deep-litter system[J]. China Animal Husbandry & Veterinary Medicine, 2014, 41(2): 139-143. |
| [9] |
郑雪芳, 刘波, 林营志, 等. 利用磷脂脂肪酸生物标记分析猪舍基质垫层微生物亚群落的分化[J]. 环境科学学报, 2009, 29(11): 2306-2317. ZHENG Xue-fang, LIU Bo, LIN Ying-zhi, et al. Using phospholipid fatty acid biomarkers for analysis of the microbial subcommunity in pigsty litter[J]. Acta Scientiae Circumstantiae, 2009, 29(11): 2306-2317. |
| [10] |
Yin H M, Du D X, Xue J, et al. Molecular analysis of bacterial diversity in pig deep litter system[J]. Journal of Pure & Applied Microbiology, 2015, 9(1): 9-16. |
| [11] |
Amann R I, Ludwig W, Schleifer K H. Phylogenetic identification and in situ detection of individual microbial cells without cultivation[J]. Microbiology Reviews, 1995, 59(1): 143-146. |
| [12] |
McCarthy C M, Murray L. Viability and metabolic features of bacteria indigenous to a contaminated deep aquifer[J]. Microbial Ecology, 1996, 32(3): 305-321. |
| [13] |
White D C, Pinkart H C, Ringelberg A B. Biomass measurements:Biochemical approaches[M]//Hurst C J, Knudson G R, Mclnemey M J, et al. eds. Manual of environmental microbiology. Washington DC:ASM Press, 1997.
|
| [14] |
Boschker H T S, Middelburg J J. Stable isotopes and biomarkers in microbial ecology[J]. FEMS Microbiology Ecology, 2002, 40(2): 85-95. DOI:10.1111/fem.2002.40.issue-2 |
| [15] |
Techtmann S M, Fortney J L, Ayers K A, et al. The unique chemistry of eastern Mediterranean water masses selects for distinct microbial communities by depth[J]. PLoS One, 2015, 10(3): e0120605. DOI:10.1371/journal.pone.0120605 |
| [16] |
Frostegård A, Tunlid A, Bååth E. Phospholipid fatty acid composition, biomass, and activity of microbial communities from two soil types experimentally exposed to different heavy metals[J]. Applied and Environmental Microbiology, 1993, 59(11): 3605-3617. |
| [17] |
Kourtev P S, Ehrenfeld J G, Häggelom M. Exotic plant species alter the microbial community structure and function in the soil[J]. Ecology, 2002, 83(11): 3152-3166. DOI:10.1890/0012-9658(2002)083[3152:EPSATM]2.0.CO;2 |
| [18] |
Zelles L, Palojärvi A, Kandeler E. Changes in soil microbial properties and phospholipid fatty acid fractions after chloroform fumigation[J]. Soil Biology and Biochemistry, 1997, 29(10): 1325-1336. |
| [19] |
Breulmann M, Masyutenko N P, Kogut B M, et al. Short-term bioavailability of carbon in soil organic matter fractions of different particle sizes and densities in grassland ecosystems[J]. Science of the Total Environment, 2014, 497/498: 29-37. DOI:10.1016/j.scitotenv.2014.07.080 |
| [20] |
Eo J, Park K C, Kim M H. Plant-specific effects of sunn hemp(Crotalaria juncea) and sudex(Sorghum bicolor×Sorghum bicolor varr. sudanense) on the abundance and composition of soil microbial community[J]. Agriculture, Ecosystems & Environment, 2015, 213: 86-93. |
| [21] |
Hamman S T, Burke I C, Stromberger M E. Relationships between microbial community structure and soil environmental conditions in a recently burned system[J]. Soil Biology and Biochemistry, 2007, 39(7): 1703-1711. DOI:10.1016/j.soilbio.2007.01.018 |
| [22] |
Ruess L, Chamberlain P M. The fat that matters:Soil food web analysis using fatty acids and their carbon stable isotope signature[J]. Soil Biology and Biochemistry, 2010, 42(11): 1898-1910. DOI:10.1016/j.soilbio.2010.07.020 |
| [23] |
Moche M, Gutknecht J, Schulz E, et al. Monthly dynamics of microbial community structure and their controlling factors in three floodplain soils[J]. Soil Biology and Biochemistry, 2015, 90: 169-178. DOI:10.1016/j.soilbio.2015.07.006 |
| [24] |
Garland J L, Mills A L. Classification and characterization of heterotrophic microbial communities on the basis of patterns of community-level sole-carbo-source utilization[J]. Applied and Environmental Microbiology, 1991, 57(8): 2351-2359. |
| [25] |
唐启义, 冯明光. 实用统计分析及其DPS数据处理系统[M]. 北京: 科学出版社, 2002. TANG Qi-yi, FENG Ming-guang. DPS data processing system for practical statistics[M]. Beijing: Science Press, 2002. |
| [26] |
Dyaz-Ravina M, Bååth E. Development of metal tolerance in soil bacterial communities exposed to experimentally increased metal levels[J]. Applied and Environmental Microbiology, 1996, 62(8): 2970-2977. |
| [27] |
Bardgett R D, Hobbs P J, FrostegårdÅ. Changes in soil fungal:Bacterial biomass ratios following reductions in the intensity of management of upland grassland[J]. Biology and Fertility of Soils, 1996, 22(3): 261-264. DOI:10.1007/BF00382522 |
| [28] |
Klamer M, Bååth E. Microbial community dynamics during composting of straw material studied using phospholipid fatty acid analysis[J]. FEMS Microbiology Ecology, 1998, 27(1): 9-20. DOI:10.1111/fem.1998.27.issue-1 |
| [29] |
Stegera K, Jarvis A, Smårs S, et al. Comparison of signature lipid methods to determine microbial community structure in compost[J]. Journal of Microbiological Methods, 2003, 55(2): 371-382. DOI:10.1016/S0167-7012(03)00187-8 |
| [30] |
刘波, 王阶平, 陈倩倩, 等. 养猪发酵床微生物宏基因组基本分析方法[J]. 福建农业学报, 2016, 31(6): 630-648. LIU Bo, WANG Jie-ping, CHEN Qian-qian, et al. Metagenomic analysis of microbial community in a microbial fermentation-bed for pig raising[J]. Fujian Journal of Agricultural Sciences, 2016, 31(6): 630-648. |
| [31] |
赵瑞廷, 栾冬梅. 发酵床养猪的研究及应用[J]. 黑龙江畜牧兽医, 2010(3): 81-83. ZHAO Rui-ting, LUAN Dong-mei. Research and application of fermentation-bed for pig raising[J]. Heilongjiang Animal Science and Veterinary Medicine, 2010(3): 81-83. |
| [32] |
Deininger A, Tamm M, Krause R, et al. Penetration resistance and water-holding capacity of differently conditioned straw for deep litter housing systems[J]. Journal of Agricultural Engineering Research, 2000, 77(3): 335-342. DOI:10.1006/jaer.2000.0606 |
| [33] |
张圣喜, 陈法霖, 郑华. 土壤微生物群落结构对中亚热带三种典型阔叶树种凋落物分解过程的响应[J]. 生态学报, 2011, 31(11): 3020-3026. ZHANG Sheng-xi, CHEN Fa-lin, ZHENG Hua. Response of soil microbial community structure to the litter decomposition of three typical broadleaf species in mid-subtropical area, Southern China[J]. Acta Ecologica Sinica, 2011, 31(11): 3020-3026. |
| [34] |
MeriläP, Malmivaara-LämsäM, Spetz P, et al. Soil organic matter quality as a link between microbial community structure and vegetation composition along a successional gradient in a boreal forest[J]. Applied Soil Ecology, 2010, 4(2): 259-267. |
| [35] |
Saetre P, Bååth E. Spatial variation and patterns of soil microbial community structure in a mixed spruce-birch stand[J]. Soil Biology & Biochemistry, 2000, 32(7): 909-917. |
| [36] |
席劲瑛, 胡洪营, 钱易. Biolog方法在环境微生物群落研究中的应用[J]. 微生物学报, 2003, 43(1): 138-141. XI Jin-ying, HU Hong-ying, QIAN Yi. Application of biolog system in the study of microbial community[J]. Acta Microbiologica Sinica, 2003, 43(1): 138-141. |
| [37] |
郑学博, 樊剑波, 崔键, 等. 沼液还田对旱地红壤微生物群落代谢与多样性的影响[J]. 生态学报, 2016, 36(18): 5865-5875. ZHENG Xue-bo, FAN Jian-bo, CUI Jian, et al. Analysis on metabolic characteristics and diversity of soil edaphon communities in upland red soil under biogas slurry application[J]. Acta Ecologica Sinica, 2016, 36(18): 5865-5875. |
| [38] |
Maguran A E. Ecological diversity and its measurement[M]. Princeton: Princeton University Press, 1998.
|
| [39] |
Pielou E C. Mathematical ecology[M]. NewYork: John Wiley & Sons Inc, 1975.
|
| [40] |
曹志平. 土壤生态学[M]. 北京: 化学工业出版社, 2007. CAO Zhi-ping. Soil ecology[M]. Beijing: Chemical Industry Press, 2007. |