 2020, Vol. 39


2. 中国矿业大学(北京)化学与环境工程学院, 北京 100083;
3. 煤炭开采水资源保护与利用国家重点实验室, 北京 102211;
4. 农业农村部环境保护科研监测所, 天津 300191
2. School of Chemical and Environmental Engineering, China University of Mining and Technology, Beijing, Beijing 100084, China;
3. State Key Laboratory of Water Resources Protection and Utilization in Coal Mining, Beijing 102211, China;
4. Agro-Environmental Protection Institute, Ministry of Agriculture and Rural Affairs, Tianjin 300191, China
多环芳烃(Polycyclic aromatic hydrocarbons,PAHs)是目前对土壤污染程度仅次于重金属的环境污染物,其对环境和人类身体健康具有较大的潜在危害,被世界各国列为优先控制的环境污染物[1]。随着工业化、城镇化步伐的加快,人为排放的PAHs数量剧增,使得工业园区周边农田土壤PAHs的环境污染问题加剧,有超过400种的致癌性PAHs及其衍生物被发现,每年约有几十万吨的PAHs排放到大气中[2-5]。土壤是PAHs的一个汇,其主要通过干湿沉降或污水灌溉等途径进入土壤[6]。同时,农田土壤中的PAHs也是源,其可通过降雨、降雪、地表径流的冲刷作用,进入水体,影响水体及其他环境介质[7]。
国内外学者对工业区周边农田土壤中的PAHs污染情况进行了调查,结果表明不同区域工业园区周边农用地土壤中的PAHs浓度存在很大差异,农田土壤PAHs含量平均值为851.85 μg·kg-1,中位值为281.65 μg·kg-1 [8],反映出不同地区PAHs排放强度的较大差异[9],部分农田土壤的污染处于中等水平。国外学者对农田土壤中PAHs的含量进行了基础调查,其中,危地马拉城市农田土壤中17种PAHs含量为350~2 087 μg·kg-1,平均值为1 038 μg·kg-1 [10];印度德里农田土壤中16种PAHs含量范围为830~3880 μg·kg-1,平均值为1 910 μg·kg-1 [11];希腊蔬菜地PAHs含量范围为14.1~34.7 μg·kg-1 [12]。可见,国外部分农田土壤PAHs处于重度污染水平,具有潜在的生态风险。
通常,人为排放的PAHs被认为是污染农田土壤的“元凶”。PAHs可以通过土壤吸附、植物叶片及根系吸收等进入土壤环境,并通过食物链富集,最终危害到人类自身[8]。国内外对PAHs的源解析多用定性和定量两类方法:前者有比值法、特征污染物法、轮廓图法、碳同位素法等[13-17],多利用污染物的化学性质进行源识别;后者有主成分分析法和正定矩阵因子法,多用于大气、土壤和沉积物中PAHs的源解析[18-19],但定量分析用于农田土壤不同来源PAHs贡献率的研究还较少,传统的源解析方法多基于PAHs组分浓度比对污染源进行定性。为更好地解析PAHs的来源,目前将定量方法引入开展源解析,如PCA模型和PMF模型等受体模型不仅用于识别源解析,同时可估计污染源的具体贡献值。
基于农田土壤中的污染物直接影响农产品质量以及人体健康,本研究以黄河三角洲地区的石油开采区以及西南地区的铅锌冶炼区周边农田为对象,采用聚类分析、主成分分析方法(PCA)和正定矩阵因子法(PMF),确定区域污染物PAHs的浓度水平和主要贡献来源,为司法定责和环境管理提供理论支持,并为研究区域内农田土壤中PAHs的污染风险防控提供科学依据。
1 材料与方法 1.1 研究区域概况研究区域位于黄河三角洲典型石油开采区(118°00′~118°06′E,37°26′~37°30′N)和西南铅锌冶炼区(104°10′~105°35′E,26°46′~27°28′N)周边的农田(图 1)。石油开采区附近农田主要种植玉米、小麦、棉花等作物,周边有石油开采、农药生产、炼焦工业、石油化工、燃煤发电等工业活动[20],同时交通运输方式由高速公路、铁路等组成。铅锌冶炼区以山地为主,丘陵、谷坝次之,周边农田主要种植玉米、土豆等作物。该地区矿产资源丰富,蕴藏煤、铁等金属和非金属矿,且该地区土法炼锌方式历史悠久,产生的炼锌废气、废水、废渣对该地区环境产生了一定的破坏。

|
图 1 采样点位图 Figure 1 Map of the sampling sites in farmlands |
石油开采区采样区域考虑污染源分布及土地利用情况,选定工业区的东南方向,共采集土壤样品89个。铅锌冶炼区采样区采集农田土壤样品共148个。采用梅花采样法,取表层土壤(0~20 cm),并用GPS记录采样点的经纬度。土壤样品置于−20 ℃冷冻保存。经冷冻干燥后,除去石块、植物组织等杂物,研磨后过1 mm筛。
根据相关文献[21-22],对农田土壤样品的PAHs进行预处理:取10 g土样,采用二氯甲烷和正己烷作为萃取剂在加速溶剂萃取仪中进行萃取,将接收瓶中得到的萃取液旋转蒸发至2 mL后,将其转移至佛罗里硅土小柱内,再加入二氯甲烷-正己烷混合液洗脱纯化和提取,最后将提取液氮吹至1.0 mL,转移至2 mL样品瓶中待测。
1.3 样品测定测定土壤样品中16种PAHs:萘(Nap)、苊烯(Acy)、苊(Ace)、芴(Flu)、菲(Phe)、蒽(Ant)、荧蒽(Fla)、芘(Pyr)、苯并[a]蒽(BaA)、苗屈(Chr)、苯并[b]荧蒽(BbF)、苯并[k]荧蒽(BkF)、苯并[a]芘(BaP)、茚并[1,2,3-cd]芘(IcdP)、二苯并[a,h]蒽(DahA)和苯并[ghi]苝(BghiP)[20]。土壤样品中PAHs使用气质联用仪(岛津TQ8040)进行测定,测定方法参见文献[18-20]:色谱柱选择SH-Rxi-sil MS(30 m、0.25 mm、0.25 μm)石英毛细管柱;不分流进样,进样体积1 μL,溶剂延迟5 min;进样口温度、离子源温度以及传输线温度均为280 ℃,炉温升温程序为初始炉温40 ℃保持1 min,然后按30 ℃·min-1升温到150 ℃,再以10 ℃· min-1升温到290 ℃,保持20 min。
土壤样品PAHs质量控制(QA/QC)参见文献[23]。每12个样品做一次空白、平行以及加标回收样品。使用p-Terphenyl-d14作指示剂(外标法)测定土壤样品中16种PAHs的加标回收率,进行质量控制,得到的加标回收率为90.9%~115.9%。
1.4 数据分析方法使用ArcGIS 10.6进行采样点绘图;使用SPSS 24.0进行聚类分析[24]和主成分分析[25],正定矩阵因子分析采用EPA PMF 5.0模型。
PMF是美国环境保护署推荐的用于来源分配的受体模型之一[26]。PMF的目标是基于组成数据集求解源谱和源贡献[27],如公式(1)所示,其中因子数为p,源中贡献含量f,样本贡献因子为g:
|
(1) |
式中:i和j分别是样本数和化学物种数;gik表示第i个样本中第k个来源的贡献;fkj代表第k个源因子中的第j个PAH的量;p表示源因子的数量;eij代表随机误差。
通过PMF模型获得因子贡献和分布图,该模型将目标函数Q与所有样本的随机误差eij最小化,如公式(2)所示:

|
(2) |
式中:uij是第i个样本中第j个PAH的不确定值,其计算公式为:
|
(3) |

|
(4) |
式中:σ代表标准偏差;c代表PAH的含量;MDL为方法检出限[27]。
2 结果与分析 2.1 不同地区农田土壤PAHs含量及其成分组成比较表 1为石油开采区和铅锌冶炼区土壤样品中16种PAHs含量情况。铅锌冶炼区16种PAHs总含量(ΣPAHs,以干质量计,下同)的平均值(447.3 μg·kg-1)高于石油开采区(149.8 μg·kg-1);同样,铅锌冶炼区16种优控PAHs单体的检出率也高于石油开采区PAHs单体的检出率,前者PAHs单体检出率为100%的有7种,即Nap、Phe、Ant、Flu、Fla、Pyr和Chr。Trapido[28]将未受人类活动干扰的农业土壤中PAHs的本底值界定为100 μg·kg-1,以此估算出石油开采区有65.1%的采样点存在污染,铅锌冶炼区有52.0%的采样点存在污染。
|
|
表 1 研究区域农田土壤PAHs含量 Table 1 Concentrations of 16 PAHs in agricultural soils of study area |
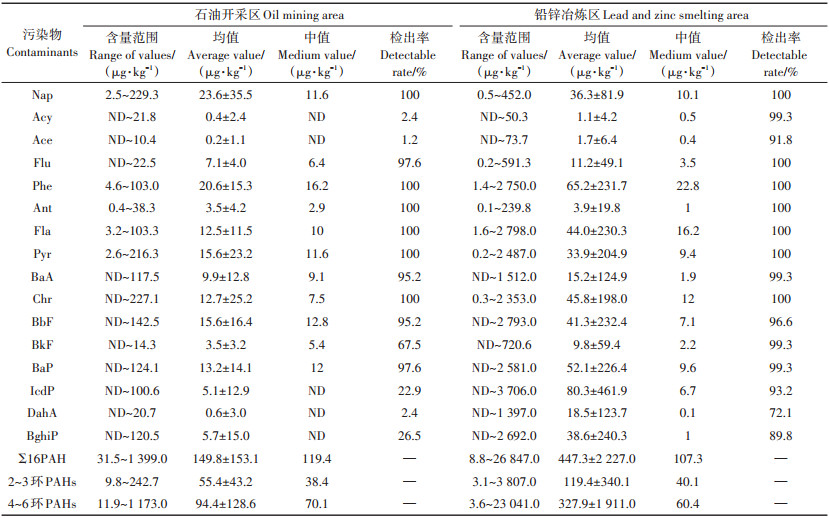
由图 2可以看出:两个区域2~3环PAHs比例最高,石油开采区农田土壤(图 2a)为14.2%~95.5%,平均为39.2%,铅锌冶炼区农田土壤(图 2b)为3.3%~75.2%,平均为41.5%。其次是4环PAHs所占比例,石油开采区农田土壤为3.4%~63.3%,平均为33.6%,铅锌冶炼区为16.6%~69.4%,平均为35.5%。农田土壤中5~6环PAHs所占比例最低,石油开采区农田土壤为0~49.2%,平均占27.2%,铅锌冶炼区为1.0%~ 76.0%,平均占22.9%。石油开采区农田土壤中低分子质量LMW PAHs(2~3环)的含量为55.4 μg·kg-1,高分子质量HMW PAHs(4~6环)的含量为94.4 μg· kg-1,LMW/HMW PAHs的比值是0.59;而铅锌冶炼区低分子质量LMW PAHs(2~3环)的平均含量为119.4 μg·kg-1,高分子质量HMW PAHs(4~6环)的平均含量为327.9 μg·kg-1,LMW/HMW PAHs的比值是0.36。说明这两个区域HMW PAHs为农田土壤主要污染成分。

|
图 2 不同地区农田土壤中多环芳烃结构组成 Figure 2 Structural composition of PAHs in farmland soil around different area |
农田土壤中PAHs有多种来源,是多个环境因素共同作用的结果。为更深入地探究不同地区农田土壤中PAHs的组成,运用聚类分析、主成分分析法(PCA)和正定矩阵因子法(PMF)分析两个研究区域农田土壤中PAHs的来源。
2.2.1 聚类分析法运用系统聚类分析定性识别两个地区农田土壤中的PAHs来源,如图 3所示。石油开采区农田土壤PAHs可以分为三大类:第一类包括Acy、Ace、BkF、Flu、Ant和DahA;第二类包括(1)BaA、IcdP、BbF和BghiP,(2)Phe、Fla、BaP、Pyr和Chr;第三类为Nap。采矿冶炼区农田土壤PAHs分为两大类:第一大类包括Acy、Ace、BkF、Flu、NaP、Ant、BaA和DahA;第二大类包括Fla、Pyr、BghiP、BbF、Chr、Phe、BaP和IcdP。

|
图 3 不同地区农田土壤中PAHs含量聚类分析图 Figure 3 Cluster analysis of PAHs content in farmland soil around different area |
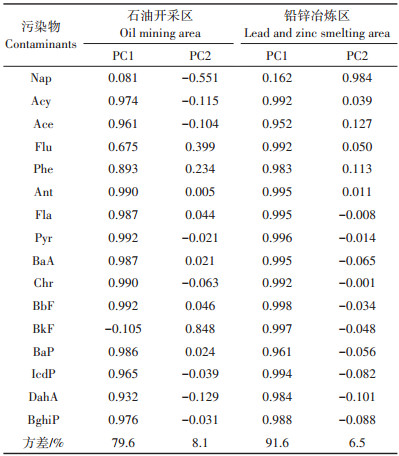
运用主成分分析法(PCA)定量解析两个地区农田土壤中的PAHs来源,进行因子分析,采用主成分提取法和最大方差旋转法,提取特征值大于1的因子[29]。两个地区均获得两个主成分,石油开采区累计方差贡献率为87.7%,铅锌冶炼区累计方差贡献率为98.1%(表 2),所得到的两个主成分能够反映原始变量总信息的85%以上。铅锌冶炼区主成分1(PC1)和主成分2(PC2)分别解释了91.6%和6.5%的方差,而石油开采区PC1和PC2分别解释了79.6%和8.1%的方差。
|
|
表 2 基于PCA的农田土壤PAHs来源分析 Table 2 Source analysis of PAHs in farmland soil based on PCA |
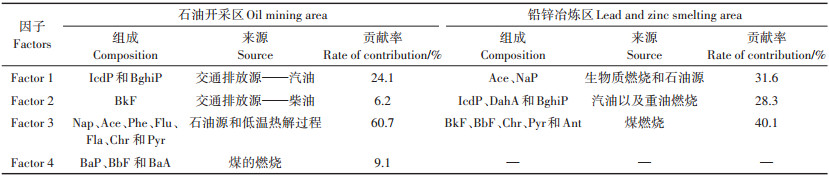
为了确保分析的合理性,通过找到最小Q值来确定因子数[30]。当使用4个因子时,Q值被最小化并保持稳定,将所有土壤样本的残差定为3.0~-3.0,且R2> 0.75,进行20次因子迭代运算[31]。为定量评估PAHs各污染源的贡献,运用PMF法对不同地区农田土壤中PAHs的污染来源进行分析,结果见表 3。石油开采区主要有4个因子,即4个污染源:因子1主要包括IcdP和BghiP,占总来源的24.1%,因子2包括的主要物质是BkF,占总来源的6.2%,因子3主要包括Nap、Ace、Phe、Flu、Fla、Chr和Pyr等3~4环的PAHs,其来源贡献率是60.7%,因子4包括BaP、BbF和BaA,贡献率是9.1%。铅锌冶炼区主要有3个因子:因子1主要由Ace和NaP组成,占总来源的31.6%,因子2的主要物质是IcdP、DahA和BghiP,占总来源的28.3%,因子3主要包括BkF、BbF、Chr、Pyr和Ant,其来源贡献率是40.1%。
|
|
表 3 基于PMF的农田土壤PAHs来源分析 Table 3 Source analysis of PAHs in farmland soil based on PMF |
相关研究表明,BaA、Fla和Chr为煤燃烧的标志物[32],低环PAHs(Nap、Acy和Ace)通常在石油源中大量存在[33],3~4环PAHs主要来源于煤、生物质、化石燃料等的燃烧[34],BbF、IcdP主要来源于汽油和柴油的燃烧[35],Nap主要来源于焦炉燃烧、汽车尾气排放和汽油泄露等[36]。因此,根据聚类分析法的定性分析结果,石油开采区第一大类主要来源于石油的泄露和生物质燃烧;第二大类主要来源于煤和化石燃料的燃烧;第三大类来源是焦炉燃烧、汽车尾气排放和汽油泄漏等。采矿冶炼区第一大类主要来源于石油泄漏和生物质的燃烧;第二大类主要来源于煤和化石燃料的燃烧。
根据主成分分析法(PCA)的结果分析,两个区域的因子1均由3~6环PAHs组成,LMW PAHs与HMW PAHs均存在这个因子中,表明该因子是一个混合源,即铅锌冶炼区的农田土壤中PAHs主要来源于煤、生物质以及化石燃料的燃烧和石油泄漏等。铅锌冶炼区中因子2解释了6.5%的方差,主要是NaP,其主要来源是焦炉燃烧、汽车尾气排放和汽油泄漏等[37],反映出该地区土壤中PAHs主要来自于石油源;石油开采区中的因子2解释了8.1%的方差,主要是BkF,其主要来自于柴油的燃烧[38-39],可能是受到拖拉机等农用器械的影响(燃油尾气排放以及燃油渗漏)[20],反映了交通排放。
对农田土壤进行正定因子矩阵法(PMF)分析,石油开采区的因子1是汽油[40-41]以及重油燃烧的典型产物[42-43],与该地区是交通枢纽有关,交通尾气的排放和汽油的燃烧可产生IcdP和BghiP;因子2是柴油燃烧的产物,可能与当地收割机、拖拉机等农用机械的使用有关[20];一些研究表明LMW PAHs是低温热解过程中的重要燃烧产物,包括煤和生物质的燃烧[44-47],是因子3的主要来源;推测因子4与该区域的燃煤发电、炼焦工业、石油化工等工业活动有关。铅锌冶炼区的3个因子中,因子1包括NaP和Ace,是国内木材燃烧和石油的标志物[44];因子2是汽油[26, 48]以及重油燃烧的典型产物[49-50];因子3中,Chr是煤燃烧的标志物,而Pyr、BkF和BbF主要出现在煤燃烧产业中[51]。因此,该地区PAHs的主要来源为燃烧源,包括木材、煤和汽油的燃烧。
本研究采用了聚类分析、PCA和PMF 3种模型对PAHs来源进行定性和定量分析。对于石油采集区域,PMF解析出4种源:汽油燃烧(24.1%)、柴油燃烧(6.2%)、生物质燃烧和石油泄漏(60.7%)与煤燃烧(9.1%)。PCA解析了煤、生物质和化石燃料燃烧的混合源以及柴油燃烧源。两种方法得出的源成分谱相似。对于西南采矿冶炼区,PMF模型解析出3种源:生物质燃烧和汽油泄露(31.6%)、汽油及重油的燃烧(28.3%)和煤燃烧(40.1%)。聚类分析定性识别了农田土壤PAHs的可能来源,PCA解析了煤、生物质和化石燃料燃烧的混合源以及柴油燃烧源。3种方法相互补充、相互印证,但PMF方法更为详尽。石油开采区农田土壤PAHs主要来源于生物质的燃烧和石油泄漏,燃煤加剧了农田土壤PAHs的富集,这与石油开采区相符合。采矿冶炼区农田土壤PAHs主要来源于煤燃烧,但是生物质燃烧和汽油泄漏以及汽油、重油的燃烧比例也相当大,一方面该区域采矿冶炼活动会加大交通排放量,另一方面以生物质燃烧为主的居民生活会导致周边表层土壤PAHs累积。陈凤等[52]采用比值法对铅锌采矿冶炼农田土壤PAHs进行了源解析,结果表明农田土壤PAHs主要来源为煤和生物质的不完全燃烧及石油源,这与本文的研究结果一致。
4 结论(1)两个地区有机污染高风险区农田土壤均检测出PAHs污染,其中,石油开采区PAHs总量为31.5~1399.0 μg·kg-1,平均含量为149.8 μg·kg-1,铅锌冶炼区多环芳烃总量为8.99~2 231.0 μg·kg-1,平均含量为267.6 μg·kg-1,主要以4~6环PAHs为主;铅锌冶炼区周边农田土壤PAHs污染程度相对较高。
(2)石油开采区农田土壤中PAHs主要来源及其贡献率分别为燃煤9.1%、生物质燃烧60.7%、化石燃烧24.1%、柴油燃烧6.2%;铅锌冶炼区农田土壤中PAHs主要来源及其贡献率分别为生物质燃烧31.6%、汽油及重油的燃烧28.3%、煤燃烧40.1%。
| [1] |
Chen Y, Zhang J, Zhang F, et al. Contamination and health risk assessment of PAHs in farmland soils of the Yinma River Basin, China[J]. Ecotoxicology and Environmental Safety, 2018, 156: 383-390. DOI:10.1016/j.ecoenv.2018.03.020 |
| [2] |
王连生. 有机污染化学[M]. 北京: 高等教育出版社, 2004. WANG Lian-sheng. Chemistry of organic pollution[M]. Beijing: Higher Education Press, 2004. |
| [3] |
戴朝霞, 陈振翔, 王格慧, 等. 典型城市大气颗粒物中多环芳烃的污染研究[J]. 环境科学与技术, 2006, 29(2): 29-31. DAI Zhao-xia, CHEN Zhen-xiang, WANG Ge-hui, et al. Study on polycyclic aromatic hydrocarbons in aerosol of representative cities[J]. Environmental Science & Technology, 2006, 29(2): 29-31. |
| [4] |
Fu X W, Li T Y, Ji L, et al. Occurrence, sources and health risk of polycyclic aromatic hydrocarbons in soils around oil wells in the border regions between oil fields and suburbs[J]. Ecotoxicology & Environmental Safety, 2018, 157: 276-284. |
| [5] |
孔娇, 程柱, 董洁, 等. 平朔煤热解过程中PAHs的释放特性[J]. 燃料化学学报, 2013, 41(11): 1281-1286. KONG Jiao, CHENG Zhu, DONG Jie, et al. Release of PAHs during pyrolysis of Pingshuo coal[J]. Journal of Fuel Chemistry and Technology, 2013, 41(11): 1281-1286. |
| [6] |
Cetin B. Investigation of PAHs, PCBs and PCNs in soils around a heavily industrialized area in Kocaeli, Turkey:Concentrations, distributions, sources and toxicological effects[J]. Science of the Total Environment, 2016, 560/561: 160-169. DOI:10.1016/j.scitotenv.2016.04.037 |
| [7] |
Watanabe H, Nakajima F, Kasuga I, et al. Toxicity evaluation of road dust in the runoff process using a benthic ostracod Heterocypris incongruens[J]. Science of the Total Environment, 2011, 409(12): 2366-2372. DOI:10.1016/j.scitotenv.2011.03.001 |
| [8] |
尚庆斌, 段永红, 程荣. 中国农业土壤多环芳烃污染现状及来源研究[J]. 山东农业科学, 2019, 51(3): 62-67. SHANG Qing-bin, DUAN Yong-hong, CHENG Rong. Pollution status and sources of polycyclic aromatic hydrocarbons in agricultural soils in China[J]. Shandong Agricultural Sciences, 2019, 51(3): 62-67. |
| [9] |
Li J K, Song X Y, Wei J B, et al. Pollution characteristics and source apportionment of polycyclic aromatic hydrocarbons in soils of Shenyang North New Area[J]. Environmental Science, 2018, 39(1): 379-388. |
| [10] |
Kasaraneni V K, Oyanedel-Craver V. Polycyclic aromatic hydrocarbon contamination in soils of san mateo ixtatán, Guatemala:Occurrence, sources, and health risk assessment[J]. Journal of Environmental Quality, 2016, 45(5): 1635-1643. DOI:10.2134/jeq2015.11.0585 |
| [11] |
Agarwal T, Khillare P S, Shridhar V, et al. Pattern, sources and toxic potential of PAHs in the agricultural soils of Delhi, India[J]. Journal of Hazardous Materials, 2009, 163(2/3): 1033-1039. |
| [12] |
Chrysikou L, Gemenetzis P, Kouras A, et al. Distribution of persistent organic pollutants, polycyclic aromatic hydrocarbons and trace elements in soil and vegetation following a large-scale landfill fire in northern Greece[J]. Environment International, 2008, 34(2): 210-225. DOI:10.1016/j.envint.2007.08.007 |
| [13] |
Yunker M B, Macdonald R W, Vingarzan R, et al. PAHs in the Fraser River basin:A critical appraisal of PAH ratios as indicators of PAH source and composition[J]. Organic Geochemistry, 2002, 33(4): 489-515. DOI:10.1016/S0146-6380(02)00002-5 |
| [14] |
Zhou J L, Siddiqui E, Ngo H H, et al. Estimation of uncertainty in the sampling and analysis of polychlorinated biphenyls and polycyclic aromatic hydrocarbons from contaminated soil in Brighton, UK[J]. Science of the Total Environment, 2014, 497/498: 163-171. DOI:10.1016/j.scitotenv.2014.07.097 |
| [15] |
翟梦晓.黄淮水系河南段表层沉积物中多环芳烃的赋存特征及来源解析[D].新乡: 河南师范大学, 2011. ZHAI Meng-xiao. Distribution and sources of polycyclic aromatic hydrocarbons in sediment from Henan reach of Huaihe, Huanghe water[D]. Xinxiang: Henan Normal University, 2011. |
| [16] |
Lin C, Liu J L, Wang R M, et al. Polycyclic aromatic hydrocarbons in surface soils of Kunming, China:Concentrations, distribution, sources, and potential risk[J]. Journal of Soil Contamination, 2013, 22(7): 753-766. DOI:10.1080/15320383.2013.768201 |
| [17] |
郝蓉, 宋艳暾, 万洪富, 等. 南亚热带典型地区农业土壤中多环芳烃和有机氯农药研究[J]. 生态学报, 2007, 27(5): 2021-2029. HAO Rong, SONG Yan-tun, WAN Hong-fu, et al. Polycyclic aromatic hydrocarbons and organochlorine pesticides in agricultural soils from typical area of south subtropics, China[J]. Acta Ecologica Sinica, 2007, 27(5): 2021-2029. |
| [18] |
孙海峰, 张勇, 解静芳. 正定矩阵因子分解模型在环境中多环芳烃源解析方面的应用[J]. 生态毒理学报, 2015, 10(4): 25-33. SUN Hai-feng, ZHANG Yong, XIE Jing-fang. Applications of positive matrix factorization(PMF)for source apportionment of PAHs in the environment[J]. Asian Journal of Ecotoxicology, 2015, 10(4): 25-33. |
| [19] |
Sun H F, Zhang Y, Xie J F. Applications of positive matrix factorization(PMF)for source apportionment of PAHs in the environment[J]. Asian Journal of Ecotoxicology, 2015, 10(4): 25-33. |
| [20] |
邱慧, 刘月仙, 解小凡, 等. 黄河三角洲石油开采区盐渍化农田土壤多环芳烃的分布特征与源解析[J]. 环境科学, 2019, 40(8): 3509-3518. QIU Hui, LIU Yue-xian, XIE Xiao-fan, et al. Distribution characteristics and source analysis of polycyclic aromatic hydrocarbons in salinized farmland soil from the oil mining area of the Yellow River Delta[J]. Environmental Science, 2019, 40(8): 3509-3518. |
| [21] |
吕金刚, 毕春娟, 陈振楼, 等. 上海市崇明岛农田土壤中多环芳烃分布和生态风险评价[J]. 环境科学, 2012, 33(12): 4270-4275. LÜ Jin-gang, BI Chun-juan, CHEN Zhen-lou, et al. Distribution and ecological risk assessment of polycyclic aromatic hydrocarbons in agricultural soil of the Chongming Island in Shanghai[J]. Chinese Journal of Environmental Science, 2012, 33(12): 4270-4275. |
| [22] |
Syed J H, Iqbal M, Zhong G, et al. Polycyclic aromatic hydrocarbons (PAHs)in Chinese forest soils:Profile composition, spatial variations and source apportionment[J]. Scientific Reports, 2017, 7(1): 2692. DOI:10.1038/s41598-017-02999-0 |
| [23] |
Wang C H, Wu S H, Zhou S L, et al. Polycyclic aromatic hydrocarbons in soils from urban to rural areas in Nanjing:Concentration, source, spatial distribution, and potential human health risk[J]. Science of the Total Environment, 2015, 527/528: 375-383. DOI:10.1016/j.scitotenv.2015.05.025 |
| [24] |
Bao K, Zaccone C, Tao Y, et al. Source apportionment of priority PAHs in 11 lake sediment cores from Songnen Plain, northeast China[J]. Water Research, 2020, 168: 115158. DOI:10.1016/j.watres.2019.115158 |
| [25] |
Wu J, Li J, Ma M, et al. Source apportionment of soil PAH concentration and associated carcinogenic and mutagenic potencies by combined utilization of PMF and toxic assessment:A case study in north China[J]. Soil and Sediment Contamination, 2020, 29(1): 1-17. DOI:10.1080/15320383.2019.1664394 |
| [26] |
Liu J, Liu Y J, Liu Z, et al. Source apportionment of soil PAHs and human health exposure risks quantification from sources:The Yulin National Energy and Chemical Industry Base, China as case study[J]. Environmental Geochemistry and Health, 2019, 41(2): 617-632. DOI:10.1007/s10653-018-0155-3 |
| [27] |
Han B, Zheng L, Lin F X. Risk assessment and source apportionment of PAHs in surface sediments from Caofeidian Long Island, China[J]. Marine Pollution Bulletin, 2019, 145: 42-46. DOI:10.1016/j.marpolbul.2019.05.007 |
| [28] |
Trapido M. Polycyclic aromatic hydrocarbons in Estonian soil:contamination and profiles[J]. Environmental Pollution, 1999, 105(1): 67-74. |
| [29] |
Tumelo M M, Munyaradzi M, Robert I M, et al. Quantification, source apportionment and risk assessment of polycyclic aromatic hydrocarbons in sediments from Mokolo and Blood Rivers in Limpopo Province, South Africa[J]. Journal of Environmental Science & Health Environmental Science & Engineering, Part A, 2019, 55(1). DOI:10.1080/10934529.2019.1666559 |
| [30] |
Bao H Y, Hou S W, Niu H, et al. Status, sources, and risk assessment of polycyclic aromatic hydrocarbons in urban soils of Xi'an, China[J]. Environmental Science & Pollution Research, 2018, 25(19): 18947-18959. |
| [31] |
Chen X, Liu X R, Liu M, et al. Molecular characterization of PAHs based on land use analysis and multivariate source apportionment in multiple phases of the Yangtze estuary, China[J]. Environmental Science Processes & Impacts, 2018, 20: 531-543. |
| [32] |
Wu J, Xiong L J, Wu J, et al. Comparison and source apportionment of PAHs pollution of runoff from roads in suburb and urban areas of Shanghai[J]. Environmental Science, 2019, 40(5): 2240-2248. |
| [33] |
Fang X Z, Wu L, Zhang Q J, et al. Characteristics, emissions and source identifications of particle polycyclic aromatic hydrocarbons from traffic emissions using tunnel measurement[J]. Transportation Research, 2019, 67: 674-684. |
| [34] |
Abbasnejad B, Keshavarzi B, Mohammadi Z, et al. Characteristics, distribution, source apportionment, and potential health risk assessment of polycyclic aromatic hydrocarbons in urban street dust of Kerman metropolis, Iran[J]. International Journal of Environmental Health Research, 2019, 29(2): 1-18. |
| [35] |
Chen Y N, Ma J H, Duan H J, et al. Occurrence, source apportionment, and potential human health risks of metal(loid)s and PAHs in dusts from driving school campuses in an urban area of Henan, China[J]. Environmental Science & Pollution Research, 2019, 26(29): 30029-30043. |
| [36] |
Davis E M, Walker T R, Adams M, et al. Source apportionment of polycyclic aromatic hydrocarbons(PAHs)in small craft harbor(SCH) surficial sediments in Nova Scotia, Canada[J]. Science of the Total Environment, 2019, 691: 528-537. DOI:10.1016/j.scitotenv.2019.07.114 |
| [37] |
Kavouras I G, Koutrakis P, Tsapakis M. Source apportionment of urban particulate aliphatic and polynuclear aromatic hydrocarbons(PAHs) using multivariate methods[J]. Environmental Science & Technology, 2001, 35(11): 2288-2294. |
| [38] |
Nasrin R K, Peter A S, Thomas M H. PAH source fingerprints for coke ovens, diesel and gasoline engines, highway tunnels, and wood combustion emissions[J]. Atmospheric Environment, 1995, 29(4): 533-542. DOI:10.1016/1352-2310(94)00275-P |
| [39] |
Boonyatumanond R, Wattayakorn G, Togo A. Distribution and origins of polycyclic aromatic hydrocarbons(PAHs) in riverine, estuarine, and marine sediments in Thailand[J]. Marine Pollution Bulletin, 2006, 52(8): 942-956. DOI:10.1016/j.marpolbul.2005.12.015 |
| [40] |
Larsen R K, Baker J E. Source Apportionment of polycyclic aromatic hydrocarbons in the urban atmosphere:A comparison of three methods[J]. Environmental Science & Technology, 2003, 37(9): 1873-1881. |
| [41] |
Jo W K, Lee J H. In-vehicle levels of naphthalene and monocyclic aromatic compounds according to vehicle type[J]. Environmental Engineering Research, 2009, 14(3): 180-185. DOI:10.4491/eer.2009.14.3.180 |
| [42] |
Harrison R M, Smith D J T, Luhana L. Source apportionment of atmospheric polycyclic aromatic hydrocarbons collected from an urban location in Birmingham, U. K[J]. Environmental Science & Technology, 1996, 30(3): 825-832. |
| [43] |
Lee J H, Gigliotti C L, Offenberg J H. Sources of polycyclic aromatic hydrocarbons to the Hudson River Airshed[J]. Atmospheric Environment, 2004, 38(35): 5971-5981. DOI:10.1016/j.atmosenv.2004.07.004 |
| [44] |
Liu D, Lin T, Syed J H. Concentration, source identification, and exposure risk assessment of PM2.5-bound parent PAHs and nitro-PAHs in atmosphere from typical Chinese cities[J]. Scientific Reports, 2017, 7(1): 10398. DOI:10.1038/s41598-017-10623-4 |
| [45] |
Dong T T T, Lee B K. Characteristics, toxicity, and source apportionment of polycyclic aromatic hydrocarbons(PAHs) in road dust of Ulsan, Korea[J]. Chemosphere, 2009, 74(9): 1245-1253. DOI:10.1016/j.chemosphere.2008.11.035 |
| [46] |
Tian F, Chen J, Qiao X. Sources and seasonal variation of atmospheric polycyclic aromatic hydrocarbons in Dalian, China:Factor analysis with non-negative constraints combined with local source fingerprints[J]. Atmospheric Environment, 2009, 43(17): 2747-2753. DOI:10.1016/j.atmosenv.2009.02.037 |
| [47] |
Simcik M F, Eisenreich S J, Lioy P J. Source apportionment and source/sink relationships of PAHs in the coastal atmosphere of Chicago and Lake Michigan[J]. Atmospheric Environment, 1999, 33(30): 5071-5079. DOI:10.1016/S1352-2310(99)00233-2 |
| [48] |
Md H, Md K A, Anwar H, et al. Distribution, source apportionment, and risk assessment of polycyclic aromatic hydrocarbons(PAHs)in the surficial sediments from the coastal areas of Bangladesh[J]. Archives of Environmental Contamination & Toxicology, 2019, 76(2): 178-190. |
| [49] |
Zhang Y F, Wu J H, Song L, et al. Source apportionment and ecological risk assessment of PAHs in surface sediments from the Liaodong Bay, northern China[J]. Acta Oceanologica Sinica, 2018, 37(4): 12-21. DOI:10.1007/s13131-018-1179-3 |
| [50] |
Keshavarzifard M, Moore F, Keshavarzi B, et al. Distribution, source apportionment and health risk assessment of polycyclic aromatic hydrocarbons(PAHs)in intertidal sediment of Asaluyeh, Persian Gulf[J]. Environmental Geochemistry and Health, 2018, 40(2): 721-735. DOI:10.1007/s10653-017-0019-2 |
| [51] |
Chen W X, Wu X Y, Zhang H Y, et al. Contamination characteristics and source apportionment of methylated PAHs in agricultural soils from Yangtze River Delta, China[J]. Environmental Pollution, 2017, 230: 927-935. DOI:10.1016/j.envpol.2017.07.035 |
| [52] |
陈凤, 王程程, 张丽娟, 等. 铅锌冶炼区农田土壤中多环芳烃污染特征、源解析和风险评价[J]. 环境科学学报, 2017, 37(4): 1515-1523. CHEN Feng, WANG Cheng-cheng, ZHANG Li-juan, et al. Characteristics, sources apportionment and risk assessment of polycyclic aromatic hydrocarbons in agricultural soils from zinc smelting area, Guizhou Province[J]. Acta Scientiae Circumstantiae, 2017, 37(4): 1515-1523. |